




Organizer Dashboard
Help articles may not be fully accurate — they can lag behind the app due to frequent updates and automated translation. If in doubt, please contact support.
On this page
The dashboard is the first page you see after signing in as an organizer: a quick read on how your events are doing and what is waiting for you. Open it from the sidebar under Work → Dashboard. The number badge beside Dashboard in the sidebar is the total of everything in the “Needs attention” card.
What you can do here
- If the amber banner ① is showing, attendees still receive your tickets and reminders from the EventMann address. Click Set up sending email to connect your own mail server; the banner disappears as soon as an active connection is saved. See Who your emails are sent from.
- Read Needs attention ② first. Each row is one thing waiting for you on one event — approval requests, refund requests, unread attendee messages, waitlist entries, shift swaps, sponsor applications, and messages sent through your public contact form. The red figure is how many are waiting; click the row to open that queue. The card only appears when something is waiting, and it reads the same counts as the sidebar badge, so the two cannot disagree.
- Check the four figures ③: Total Revenue, Tickets Sold, Avg. Order Value and Refund Rate.
- Click Create Event ④ to open the event wizard.

The figures explained
- Total Revenue — the total of your confirmed orders, as charged: refunds are not subtracted here (the Finance screens show the net figure). If your events are priced in more than one currency you see one line per currency, never a blended total; the average order value then shows “mixed currencies” instead of a number.
- Tickets Sold — tickets on confirmed orders across all your events.
- Avg. Order Value — the average total of a confirmed order.
- Refund Rate — the share of paid orders that have had a refund, full or partial.
- The line under your name (“9 events · 4 live · 301 attendees”) counts every event you own, the ones that are live, and confirmed orders.
Events, revenue and pipeline
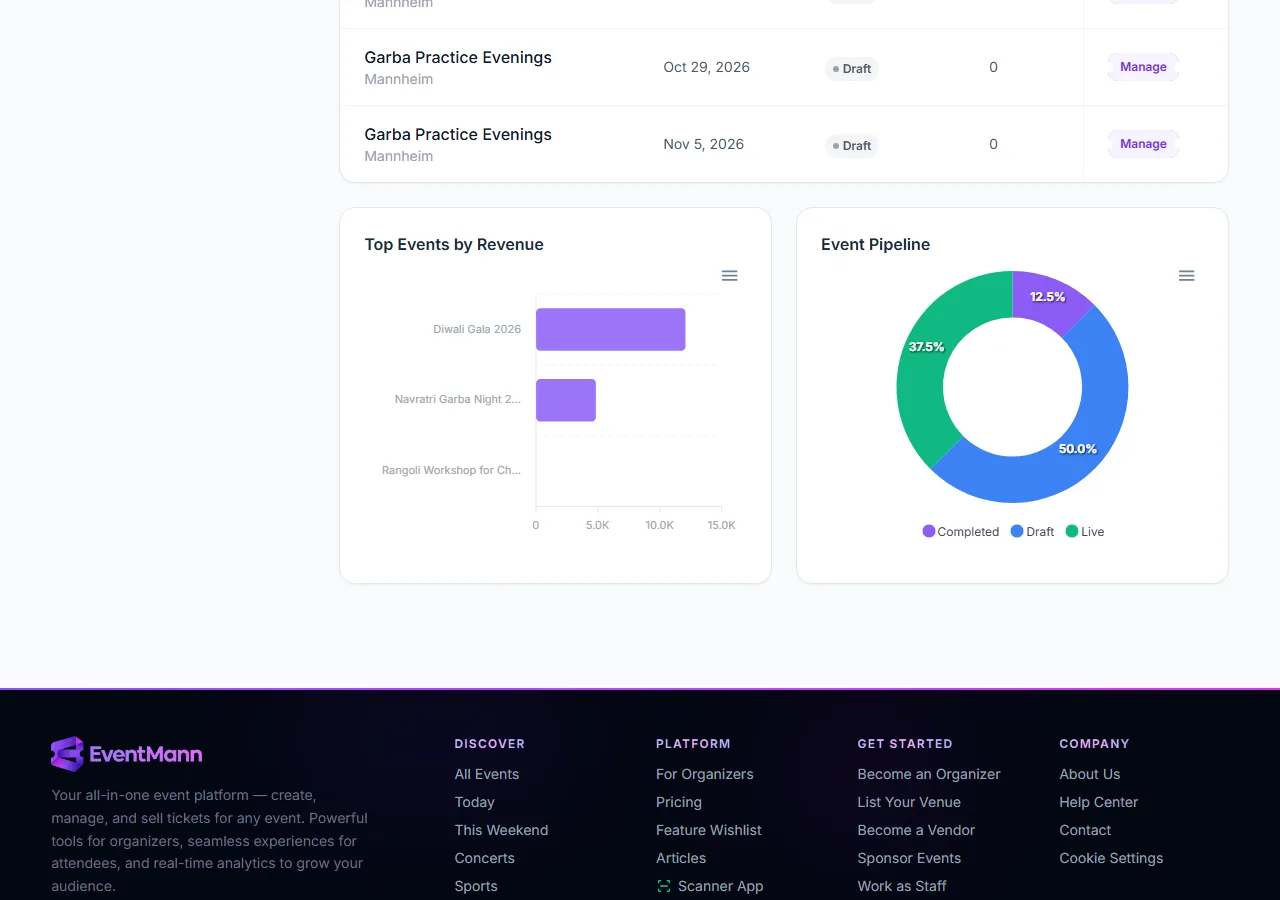
Below the figures, My Events lists a preview of your events with date, status, number of orders and a Manage button. Two charts follow: Top Events by Revenue and Event Pipeline (how many events are Draft, Scheduled, Live, Paused, Completed or Cancelled). Each chart can be downloaded as an image or CSV.
- The My Events table ① shows five events — it is a preview, in no particular order. Use View All for the complete, searchable list.
- Top Events by Revenue ② ranks your best five events.
- Event Pipeline ③ splits your events by lifecycle status.
Good to know
- The status badge in the table is the real lifecycle status (Draft, Scheduled, Live, Paused, Completed, Cancelled). An event waiting in the platform’s review queue shows the review state beneath it.
- An event title links to the public page while the event is Live, and to a private preview in every other status, so your own link never ends in a “not found”.
- A new account also sees a Setup progress card here until the checklist is finished or dismissed — see Getting Started.
Troubleshooting
- Revenue looks lower than what I have sold — only confirmed orders count. An order still in checkout, or one that was cancelled, is left out on purpose.
- An event is missing from the table — the table only shows five. Use View All.
- The amber banner will not go away — it clears only once a working mail connection is saved under Settings → SMTP & Mail.
- The Needs attention number differs from a queue page — the card is cached for about 30 seconds; reload after acting on a queue.