




Analytics
Venue Owner Guide
2 min read
Help articles may not be fully accurate — they can lag behind the app due to frequent updates and automated translation. If in doubt, please contact support.
On this page
- 1. What you can do here
- 2. The four figures
- 3. The charts
- 4. Good to know
- 5. Troubleshooting
- 6. Related
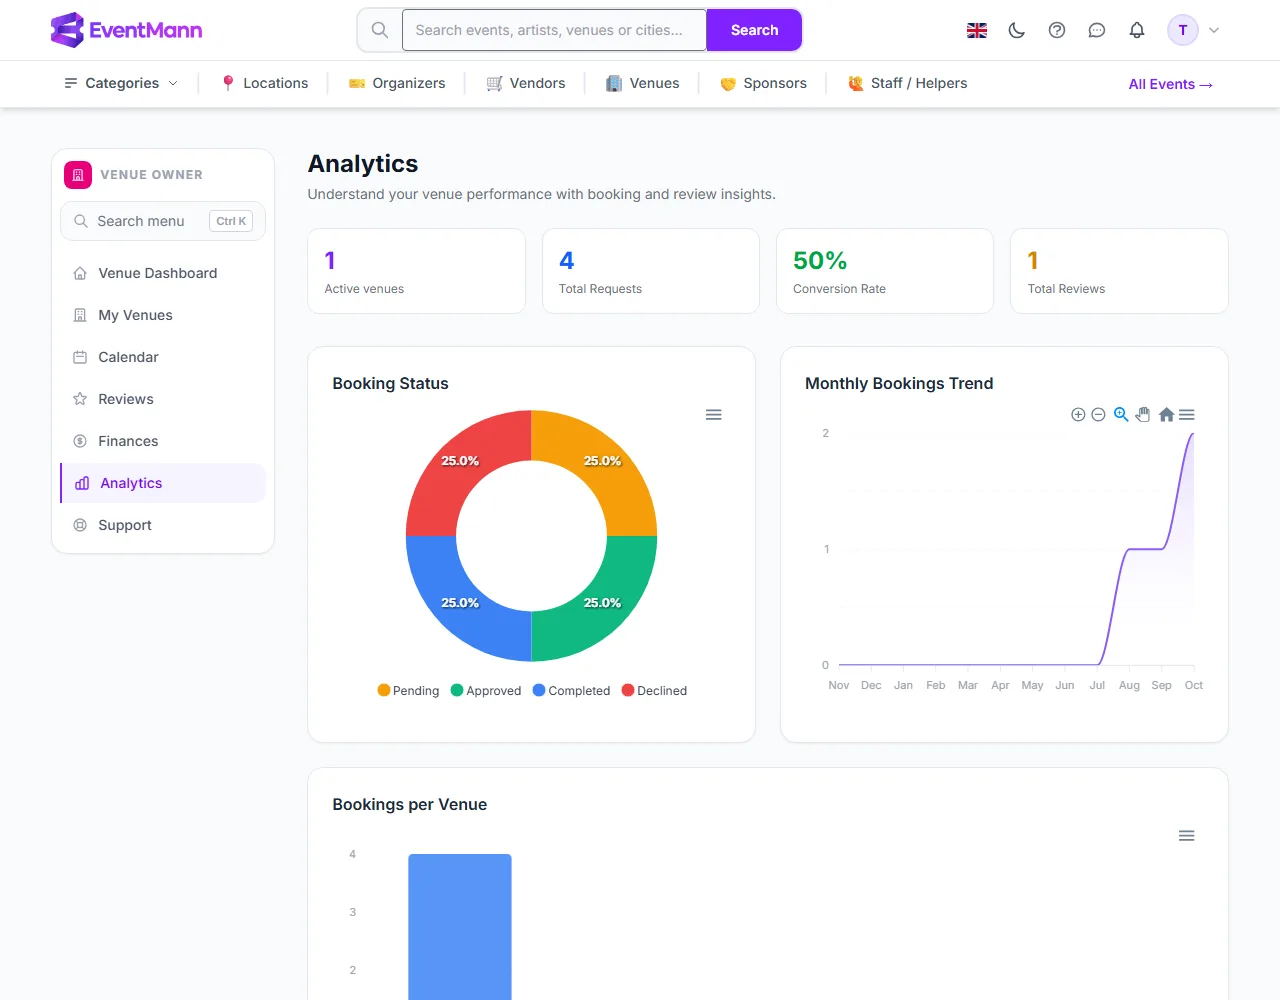
The Analytics page (sidebar) shows how booking requests to your venues turn into bookings: four headline figures and five charts — the status of your requests, requests per month, requests per venue, the conversion rate per venue and the average rating per venue. Everything is counted from the requests and reviews you have received; EventMann does not measure visits to your venue page.
What you can do here
- See how many requests you get and how many you turn into bookings.
- Compare your venues with each other.
- Save any chart as an image or as CSV.
The four figures
| Figure | Definition |
|---|---|
| Active venues ① | Venues that are approved and switched on — the same definition as on the dashboard. |
| Total Requests | All booking requests ever received for all your venues, whatever their status. |
| Conversion Rate ② | Requests that are Approved or Completed, divided by all requests, as a percentage. Pending, declined and cancelled requests count in the denominator only. |
| Total Reviews | All reviews of your venues. |
The charts
- Booking Status ③ — a ring with the share of Pending, Approved, Completed and Declined requests. Cancelled requests are not drawn.
- Monthly Bookings Trend — requests per month for the last twelve months, by the month the request was made.
- Bookings per Venue — the number of requests each venue received.
- Conversion Rate by Venue — the conversion rate of each venue.
- Average Rating by Venue — shown only for venues that have reviews.
Good to know
- A low conversion rate is not necessarily bad: organizers often ask several venues for the same date, and a declined request for a date you had already blocked is expected.
- The charts count requests, not guests or money. For the value of bookings see Finances.
- Venues without any requests still appear in the per-venue charts, with zero.
- There is no date filter. The monthly chart always shows the last twelve months.
- EventMann does not track page views or searches for your venue, so there is no “views to requests” figure.
Troubleshooting
- The status ring is missing — it appears only when you have at least one request.
- The conversion rate dropped after an organizer cancelled — cancelled requests count in the total, which lowers the percentage.
- A venue is missing from the rating chart — it has no reviews yet.