




Event Analytics
Organizer Guide
3 min read
Help articles may not be fully accurate — they can lag behind the app due to frequent updates and automated translation. If in doubt, please contact support.
On this page
Analytics is the sales and check-in view of one event. Open the event and choose Analytics & Reports → Analytics in the event sidebar. The page has three tabs: Overview (this page), Event Insights and Reports. You need the analytics permission to see the Overview; team roles that hold only reports or insights see the other tabs.
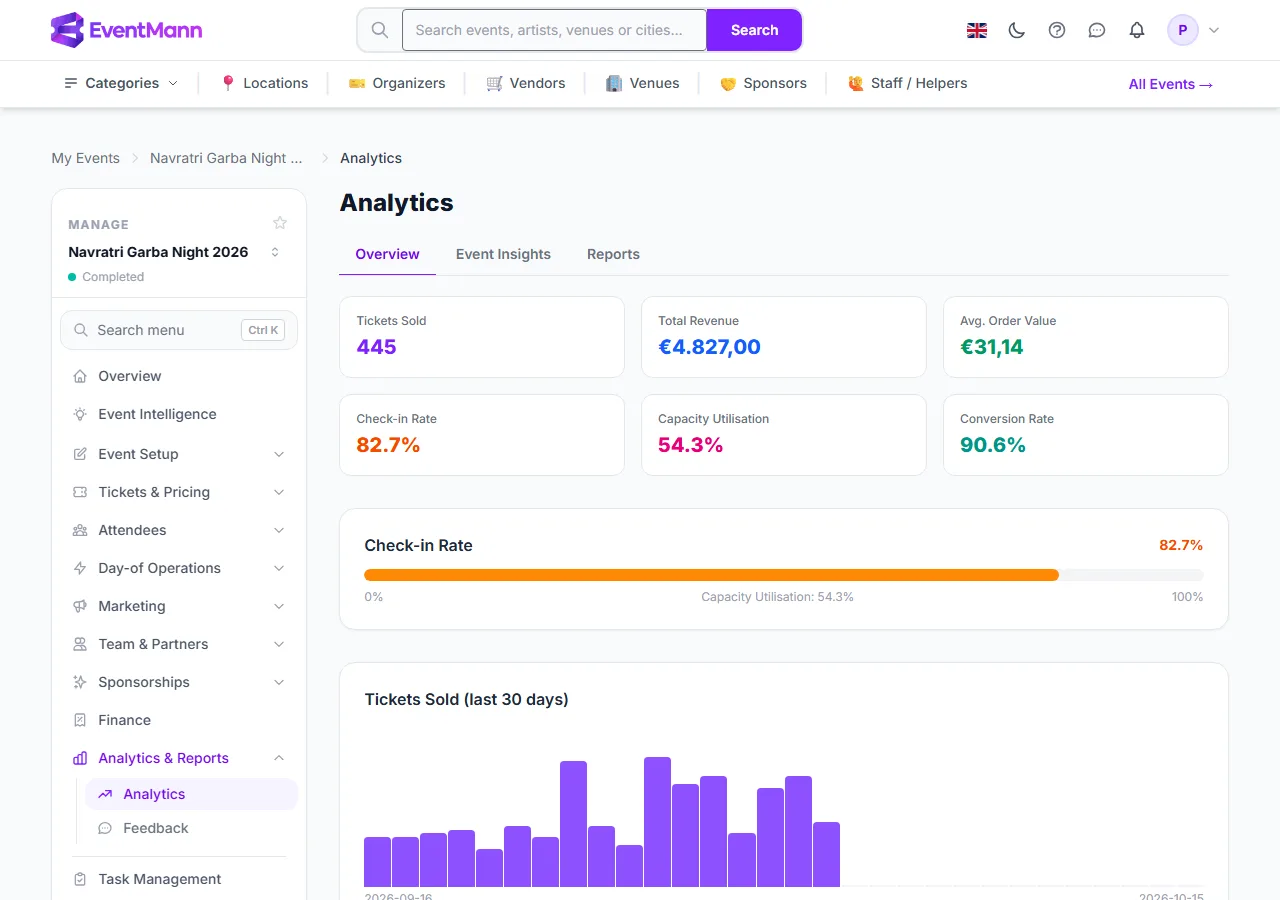
- Open Analytics ① under Analytics & Reports.
- Tickets Sold ② and the other cards give the headline numbers for this event only.
- Check-in Rate ③ is the share of confirmed tickets that have been scanned at the door.
- Conversion Rate ④ is confirmed orders divided by all orders ever started for the event.
- Tickets Sold (last 30 days) ⑤ is a chart of tickets per day.
What each number means
- Tickets Sold — ticket quantities on confirmed orders.
- Total Revenue — the sum of confirmed order totals, in the event’s currency. Refunds are not taken off here; use Reports or Finance for money after refunds.
- Avg. Order Value — the average confirmed order.
- Check-in Rate — scanned tickets divided by confirmed tickets. This is the figure you watch on the day, so it refreshes every two minutes.
- Capacity Utilisation — tickets sold divided by the total quantity of all ticket types. It can read over 100% if a type was oversold.
- Conversion Rate — confirmed orders divided by all orders ever started, including ones abandoned before payment. It is not based on page views, which EventMann does not measure.
- The 30-day chart — grouped by the date an order was paid, with empty days shown as zero so the chart always spans 30 days.
Revenue by ticket type, cities and export
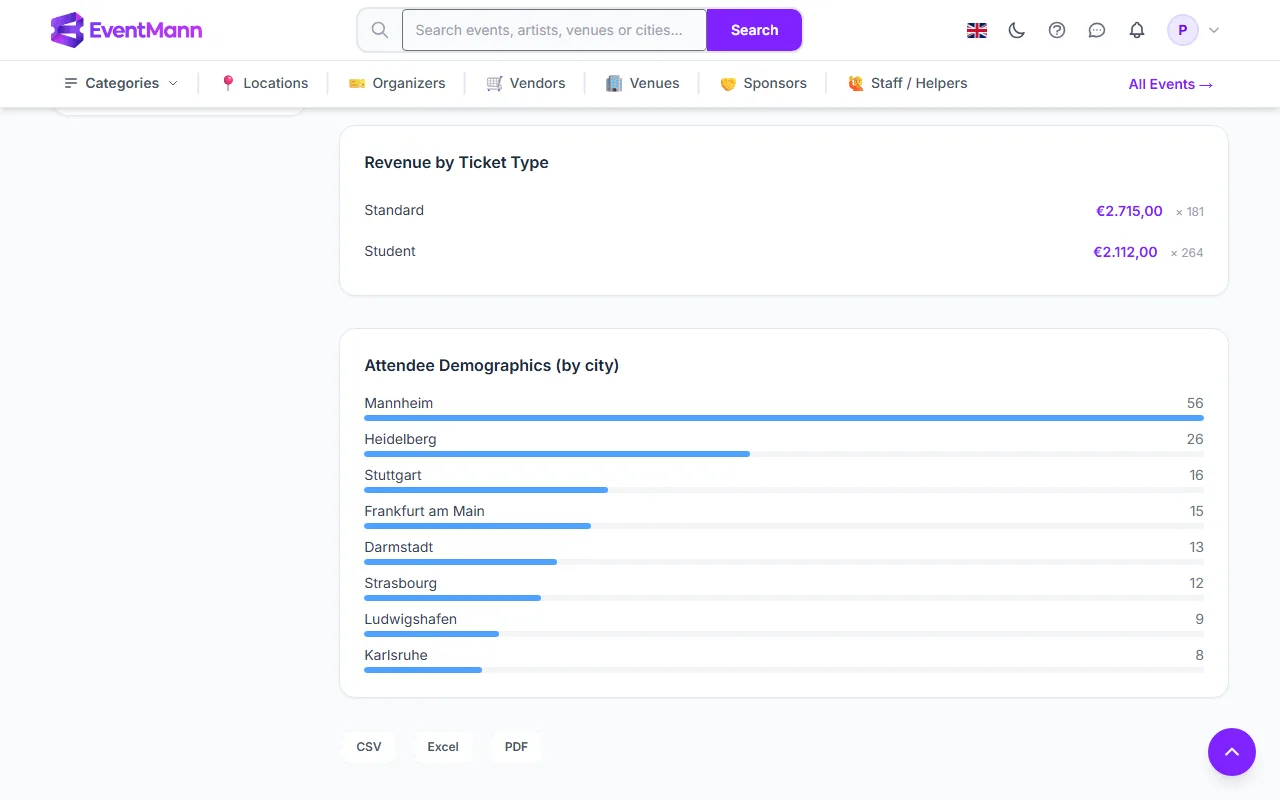
- Revenue by Ticket Type ① lists what each ticket type earned and how many sold.
- Attendee Demographics (by city) ② shows the ten cities your buyers come from, by number of orders.
- The CSV ③, Excel and PDF ④ buttons download the ticket-type table.
Good to know
- Every figure excludes pending, cancelled and refunded orders; only confirmed ones count.
- Figures are kept for up to ten minutes (two for the check-in rate), so a sale that just settled may take a moment.
- For the whole account see Organizer Analytics.
Troubleshooting
- Check-in rate is 0% — nobody has been scanned yet, or the doors have not opened.
- Conversion looks low — it counts every abandoned attempt, not only completed carts.
- Capacity over 100% — more tickets were sold than the ticket types hold, for example after you reduced a quantity.
- The Overview tab is missing — your role does not include the analytics permission. Ask the organizer.