




Reports
Help articles may not be fully accurate — they can lag behind the app due to frequent updates and automated translation. If in doubt, please contact support.
On this page
Reports are exact tables of your sales, orders, refunds, tax, discounts and attendance that you can filter and download. There are two entry points with the same tables: Money → Reports covers all your events (account owner), and Analytics & Reports → Reports inside an event covers that event, with extra event-only reports.
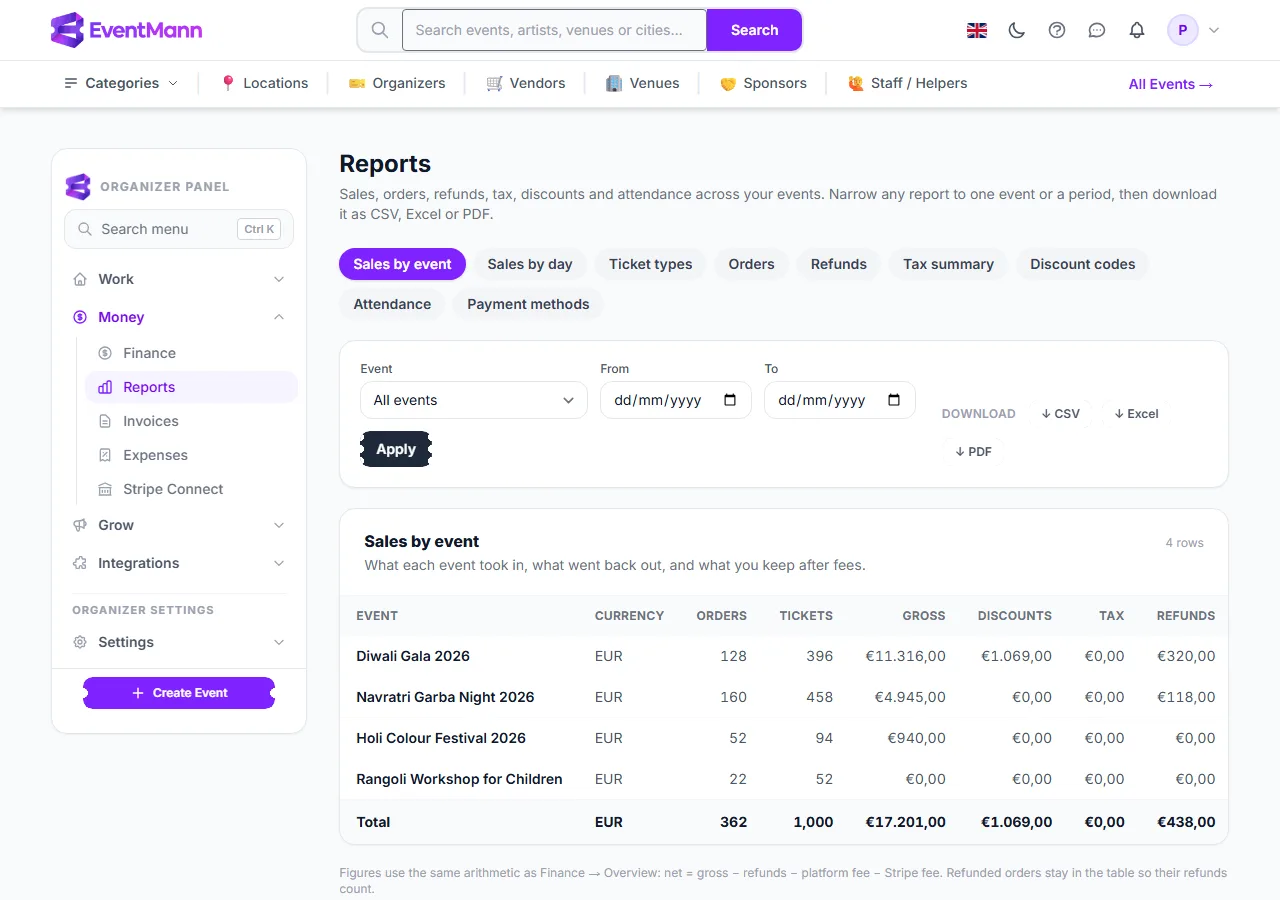
- Open Money → Reports ①.
- Pick a report from the row of tabs ②. The first is Sales by event.
- Narrow it to one Event ③ if you like.
- Set a period with From ④ and To, then click Apply ⑥. Reset clears the filters.
- Download the report you are looking at with ↓ CSV ⑤, ↓ Excel or ↓ PDF.
The reports
| Report | What it shows |
|---|---|
| Sales by event | What each event took in, what went back out, and what you keep after fees. |
| Sales by day | Orders and money per day, on the date the order was paid. |
| Ticket types | How each ticket type sold against its capacity. |
| Orders | Every order, one row each, with the full money split. |
| Refunds | Every order refunded in full or in part, with amount and reason. |
| Tax summary | Tax collected per event, the figure your tax return needs. |
| Discount codes | Which codes were used, what they cost and the revenue they carried. |
| Attendance | Tickets issued and scanned, per ticket type. |
| Payment methods | Orders and money by the method the buyer chose. |
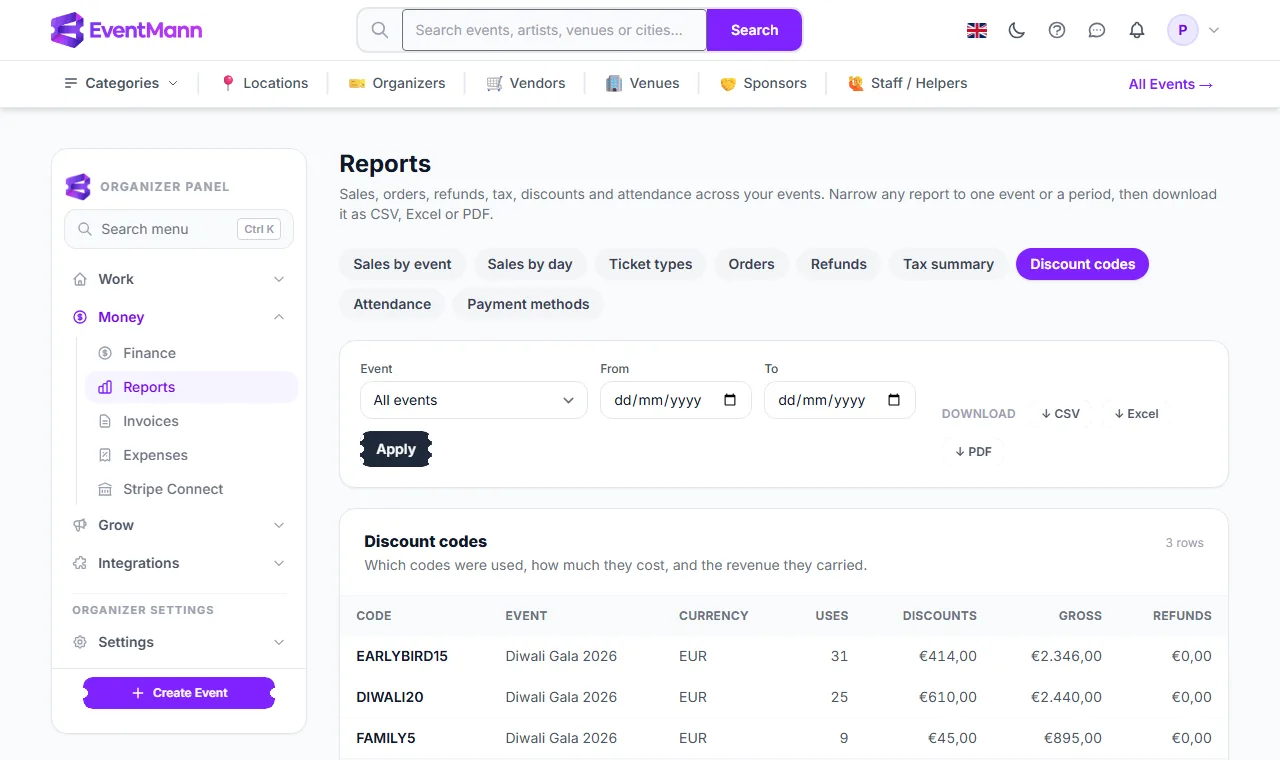
Every report has a heading with a one-line description ① and a totals row ② at the bottom. The totals cover the whole period, even when only the first rows are shown on screen.
Reports for one event
Inside an event the same nine reports are offered, plus nine that only make sense for one event.
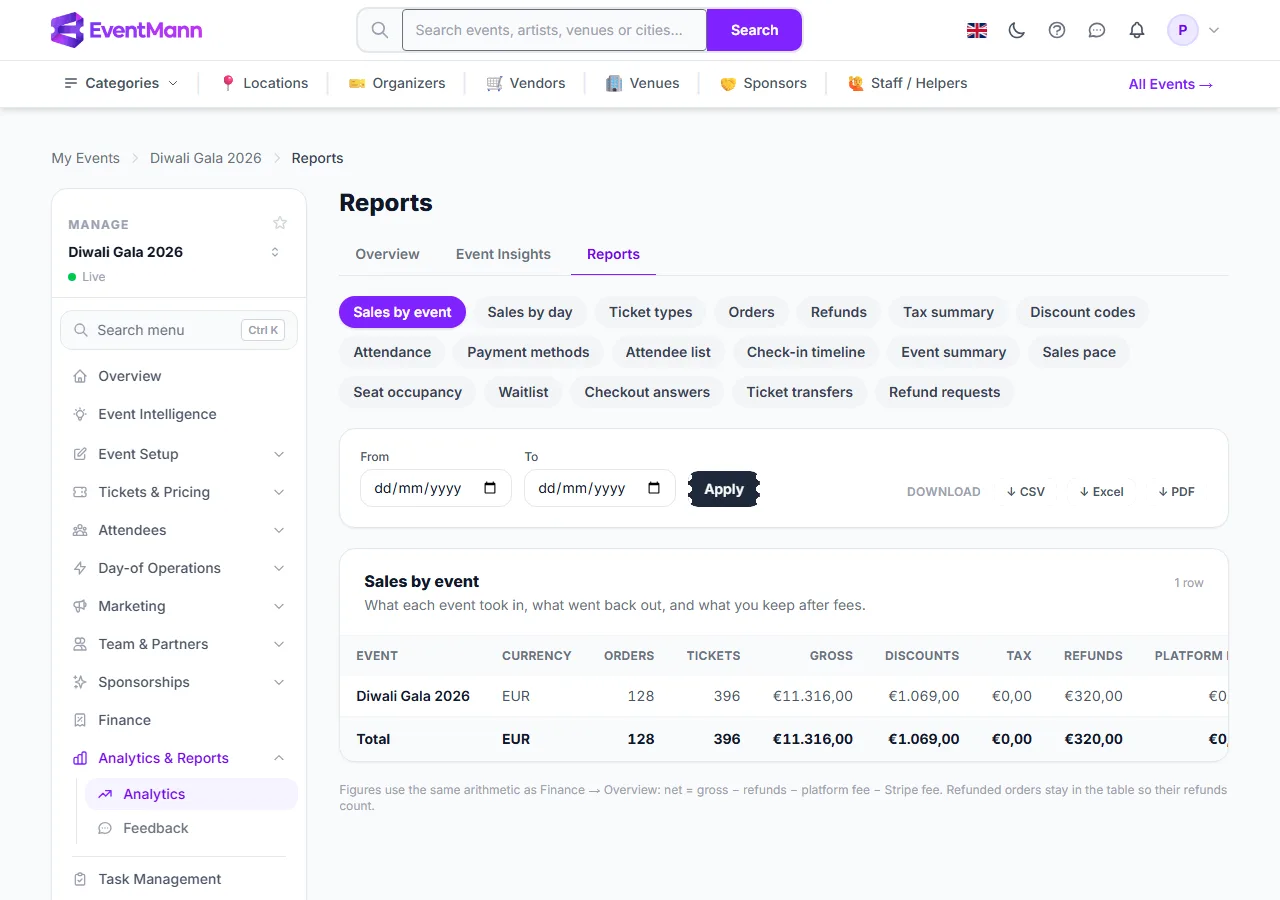
- Open Analytics & Reports in the event sidebar and click the Reports tab ①.
- Attendee list ② — every ticket that admits, one row each, with holder, seat and check-in: the door list.
- Event summary ③ — the one-page debrief: sales, attendance, money, refunds and feedback.
- Also available: Check-in timeline (scans per 15 minutes and gate, with a running count of who is inside), Sales pace (tickets and money per day counted back from the event date), Seat occupancy (empty without a seat map), Waitlist, Checkout answers, Ticket transfers and Refund requests.
- Download with ↓ Excel ④ or CSV or PDF. The download buttons only show for people who may download.
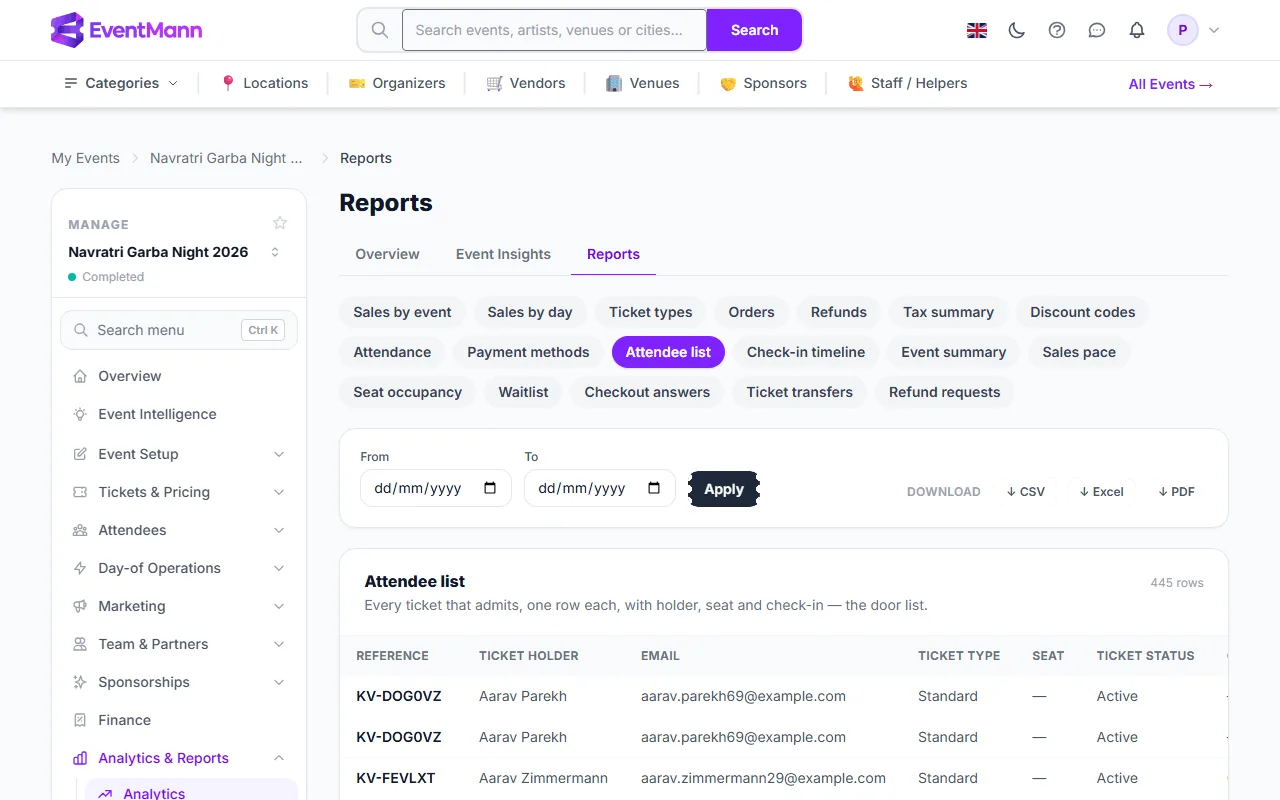
The attendee list ① (Checked in ②) is useful after the event too: it shows who actually came.
How the figures are worked out
- Money columns use the same arithmetic as Finance: net = gross − refunds − platform fee − Stripe fee. A fully refunded order stays in the table so its refund counts.
- The period filters on the order date: the day the order was paid, or placed if there was no payment step (free, comp or box-office orders). Both dates are inclusive: “to 30 September” includes the whole 30th.
- Each row carries its own currency; EventMann never adds amounts in different currencies together.
Good to know
- The screen shows at most the first 200 rows and says so. The download contains every row.
- The page address is the report. Copy it from the address bar to send an accountant the same filtered view.
- A downloaded file is named after the report, the event and the period, so several downloads do not overwrite each other.
- The account-wide page is for the owner. Team members use the event Reports tab: viewing needs the reports permission, downloading needs the export permission (usually the finance role).
Troubleshooting
- “Nothing to report for this selection” — no orders fall in that event and period. Reset the filters.
- The totals differ from the dashboard — the dashboard counts confirmed totals before partial refunds; Reports nets refunds and fees.
- I see no download buttons — your role may view reports but not export them.
- Seat occupancy is empty — the event has no seat map.